“The way to become rich is to put all your eggs in one basket and then watch that basket”
Andrew Carnegie
Since around 2015 I have been passively investing in the US stock market. Taking any gains from other activity and rolling it into the equity markets.
I haven’t been actively using any fund manager or advisor as it’s easy to get caught up in fees and I also have been directly investing in companies rather than tracker funds.
I have been bad at tracking progress so I am going to try and use this annual or bi annual review to look at relative performance of the public market equities in my portfolio.
The individual companies have developed over time with the addition of Microsoft, Meta and more recently Berkshire Hathaway but started with Amazon as the cornerstone of the portfolio.
| Ticker | Name | Allocation |
| AMZN | Amazon.com Inc | 55% |
| MSFT | Microsoft | 22% |
| META | Meta Platforms | 6% |
| VFINX | Vanguard 500 | 5% |
| BRK.A | Berkshire Hathaway | 9% |
| BRK.B | Berkshire B | 3% |
Most fund managers or financial advisors would really hate this type of concentration, both in sector, geography and also tech focus.
Now for the results (historic performance is no indication of future performance)

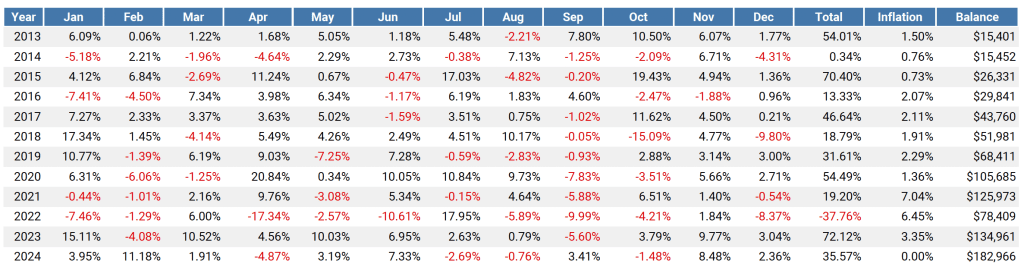
If you had invested $10,000 in 2013 in this portfolio it would now be worth just over $180,000 so an annual return of 27% CAGR and 24% adjusted for inflation. In the best year I was up 72% and in the worse year down 38%, so again reflecting the highs and lows of investing and the value of locking and leaving investments.
There is close to zero dividend yield but who cares with this level of capital appreciation.
I have included monthly returns in this table below.